

AI logs
Every AI call: what was asked, what came back, what it cost, and whether it succeeded.
The AI is the one part of the application that costs money on every use and cannot be predicted exactly in advance. So the logs go all the way down: for every request you can see the whole prompt, the whole response and the exact token budget. When something generates oddly, the answer is here rather than in guesswork.
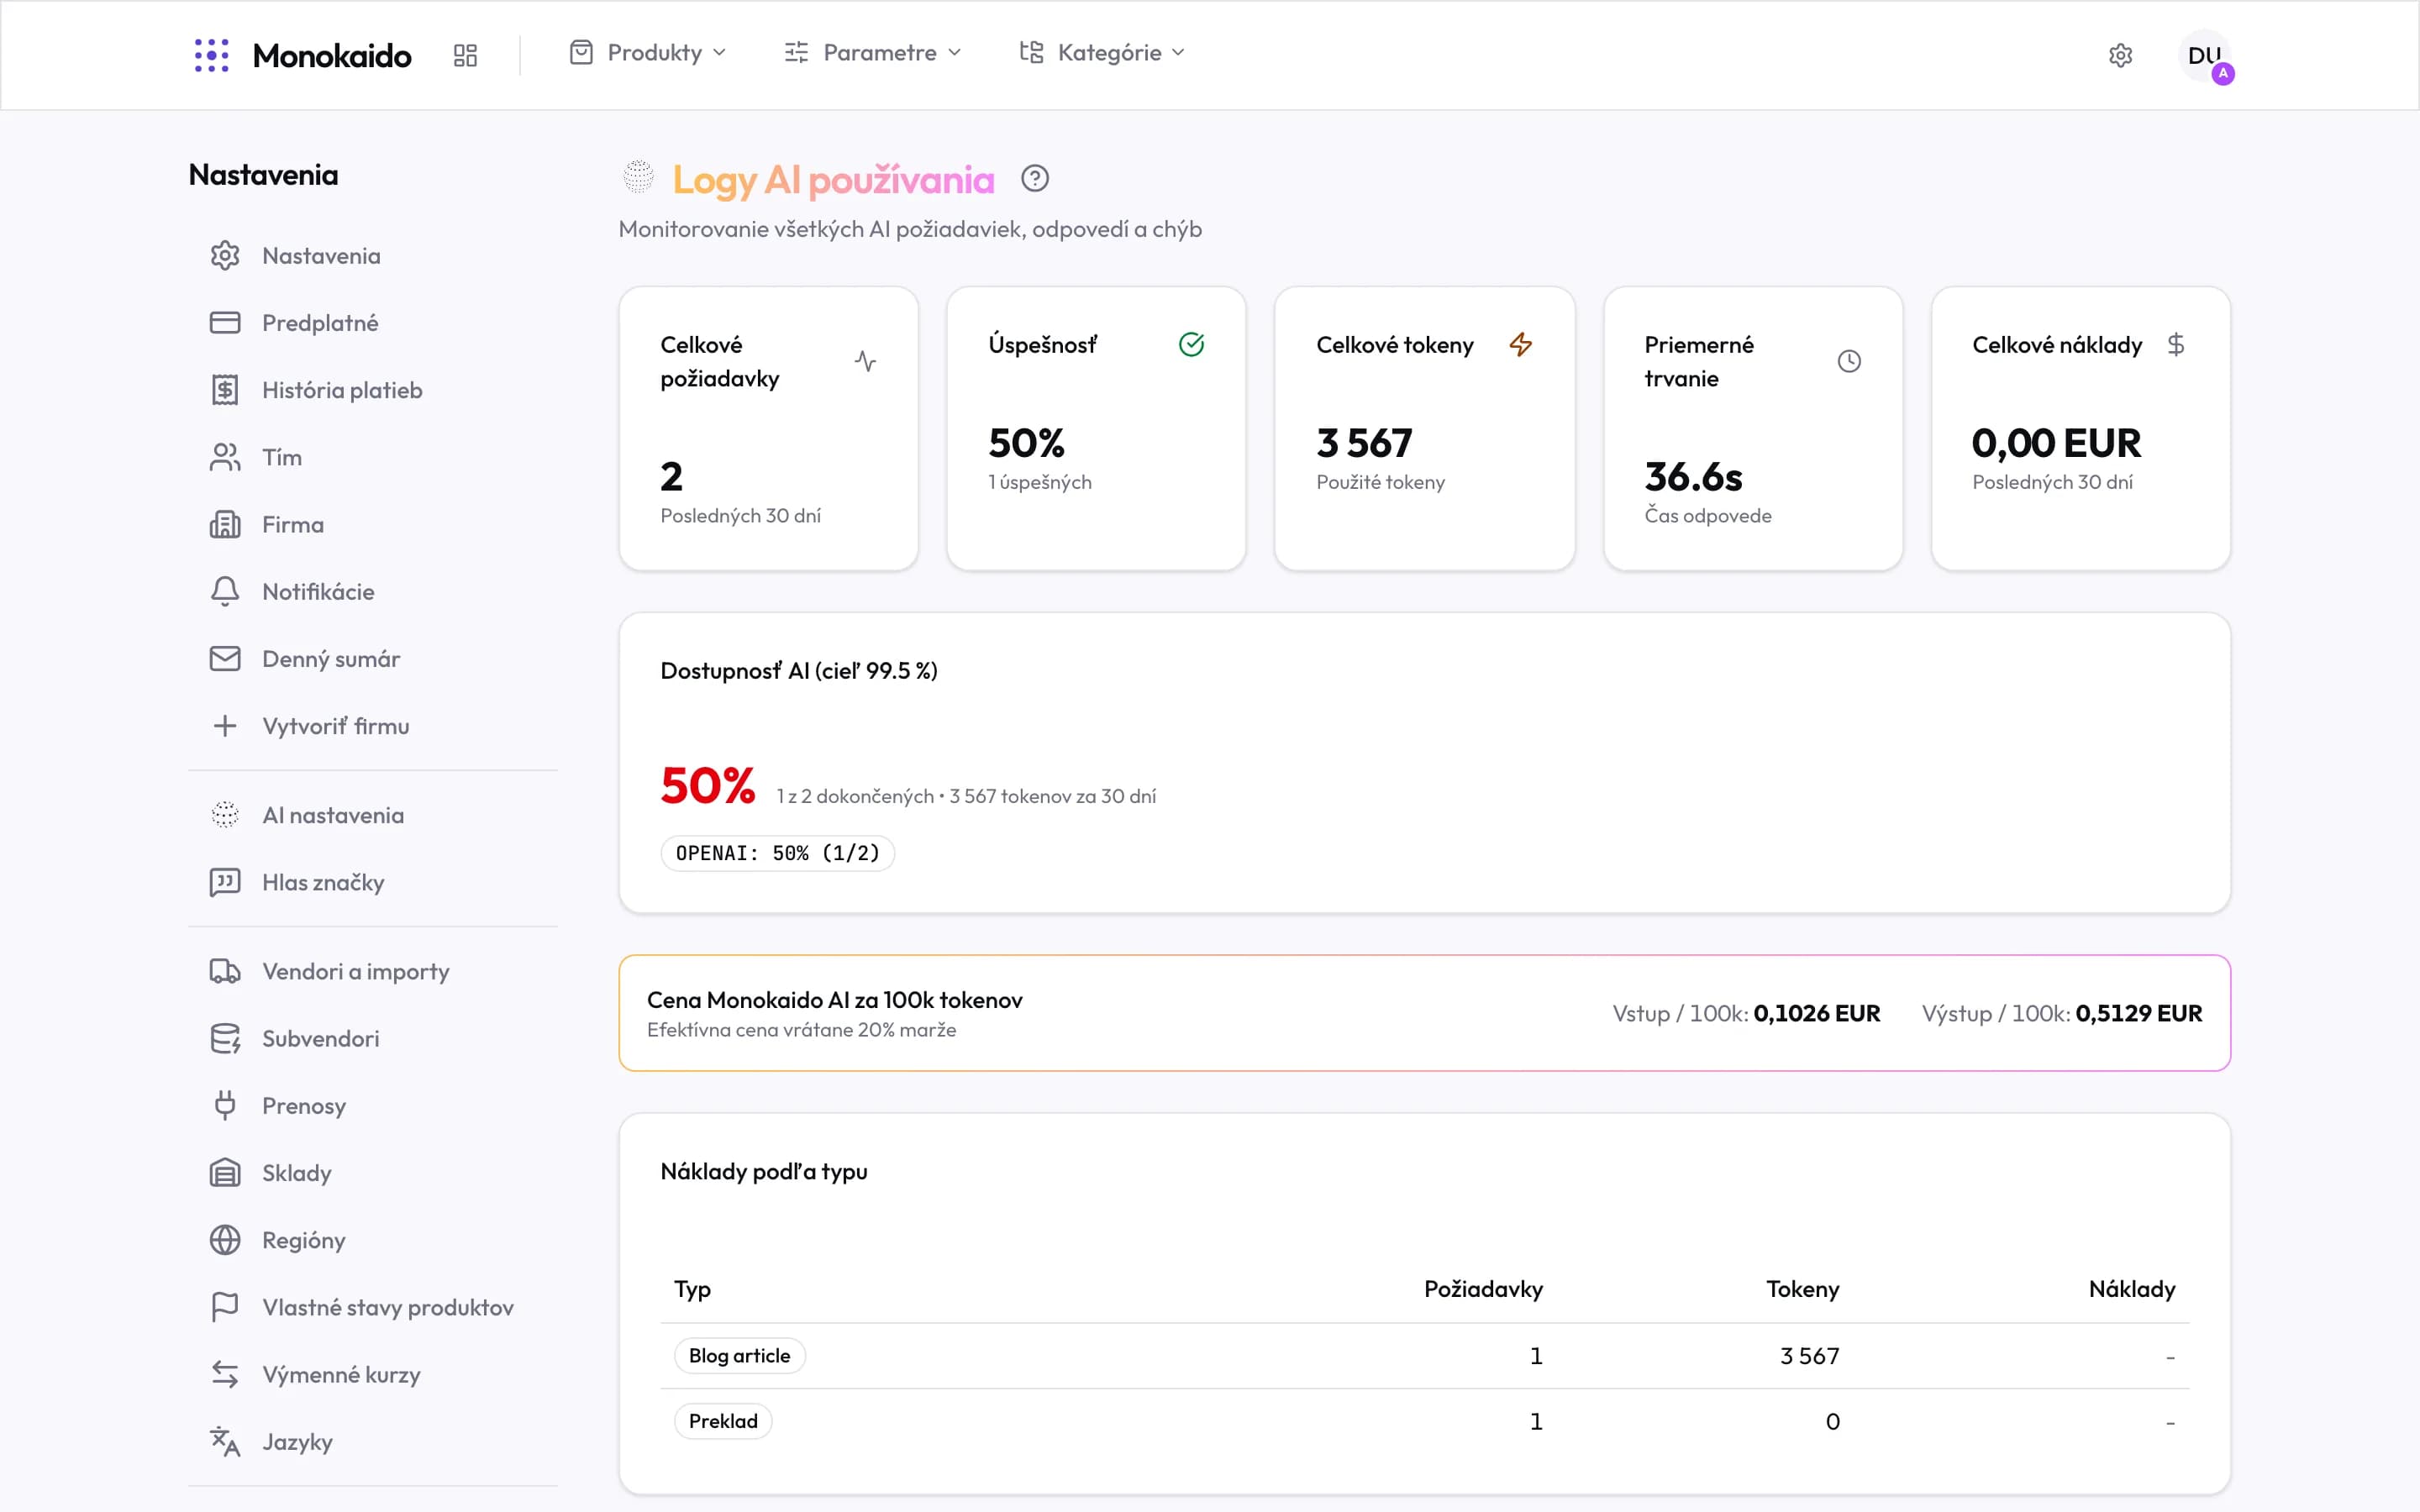
Controls on this screen
- Total requests — Calls over the last 30 days. Every card counts that window.
- Success rate — The share of completed calls. A low number means errors, not poor text.
- Total tokens — The usage that costs and the Monokaido AI credit draw are both computed from.
- Avg duration — Response time. A long description generation is normal; a long translation is not.
- Total cost — In euros over 30 days. With your own key this is an estimate from the model price list.
- AI availability — How many calls went through against the 99.5 % target. This is the health of the connection, not the quality of the output.
- Breakdown by provider — With more than one provider, you can see which of them is failing.
- Monokaido AI price — The effective price per 100k tokens including margin. Shown only on Monokaido AI.
- Cost by type — Which feature spends most. The first place to look when the bill is higher than you expected.
Filters
Three filters sit under the summary. They combine, and the URL remembers them — a filtered view can be sent to a colleague.
| Filter | What it is for |
|---|---|
| Status | Successful, failed, pending. When troubleshooting, start with failed. |
| Type | Description, parameters, category, value mapping, feed mapping, translation, alt text and more. |
| Context | Not what the AI did but what with: subvendor data, duplicates, external documents, images, dictionary, cache. |
Request detail
The eye icon at the end of a row opens AI Request Details. This is the most valuable screen in the whole AI section.
| Part of the detail | What you find in it |
|---|---|
| Model, source, type | Which model answered and where the request came from. |
| Context used | A named list of everything that went into the prompt — vendor, brand, language, parameters, images, external links and whether they loaded. |
| System prompt | The instructions the application gives itself, brand voice included. |
| User prompt | The specific product data the AI was asked about. |
| Response | Exactly what the model returned, before any processing. |
| Token usage | Input, output and cache separately (cache read 0.10×, cache write 1.25×). |
| Cost | The price broken down into input, output, cache and margin. |
| Error details | On a failed call, the code and message from the provider. |
What the numbers are telling you
| What you see | What it means |
|---|---|
| Success rate below 95 % | A technical problem — an expired key, a provider limit, an over-long prompt. Read the error detail. |
| High cost on one type | The feature runs more often than you think. Typically the same description generated repeatedly. |
| Many cache hits | Good news — a repeated prompt is billed at a tenth of the input price. |
| Input growing at unchanged output | Context has been added to the prompt (images, documents, dictionary). Check the AI settings. |
How long are logs kept?
The summary cards count the last 30 days. The request log itself reaches further back — page through it below the table.
Why is the cost marked as an estimate?
For a model we have no price list for yet, the cost is estimated from the nearest priced model in the same family. On Monokaido AI the price is exact.
Do AI calls from the shop and the blog show up here too?
They do. There is one log for the whole company, and the request type tells you where a call came from.
Where do I find out whether the AI fills parameters correctly?
The logs are the wrong tool for that — they measure operation, not quality. Quality is measured by AI accuracy.