

Blog overview
The state of drafts, the publishing schedule, and what is waiting for approval.
Requires the module BlogAvailable to roles Admin, Editor, ViewerOpen in the app (Opens in a new tab)
The blog's landing screen answers one question: is the blog healthy, or is something asking for me? When everything is green there is no reason to spend time here.
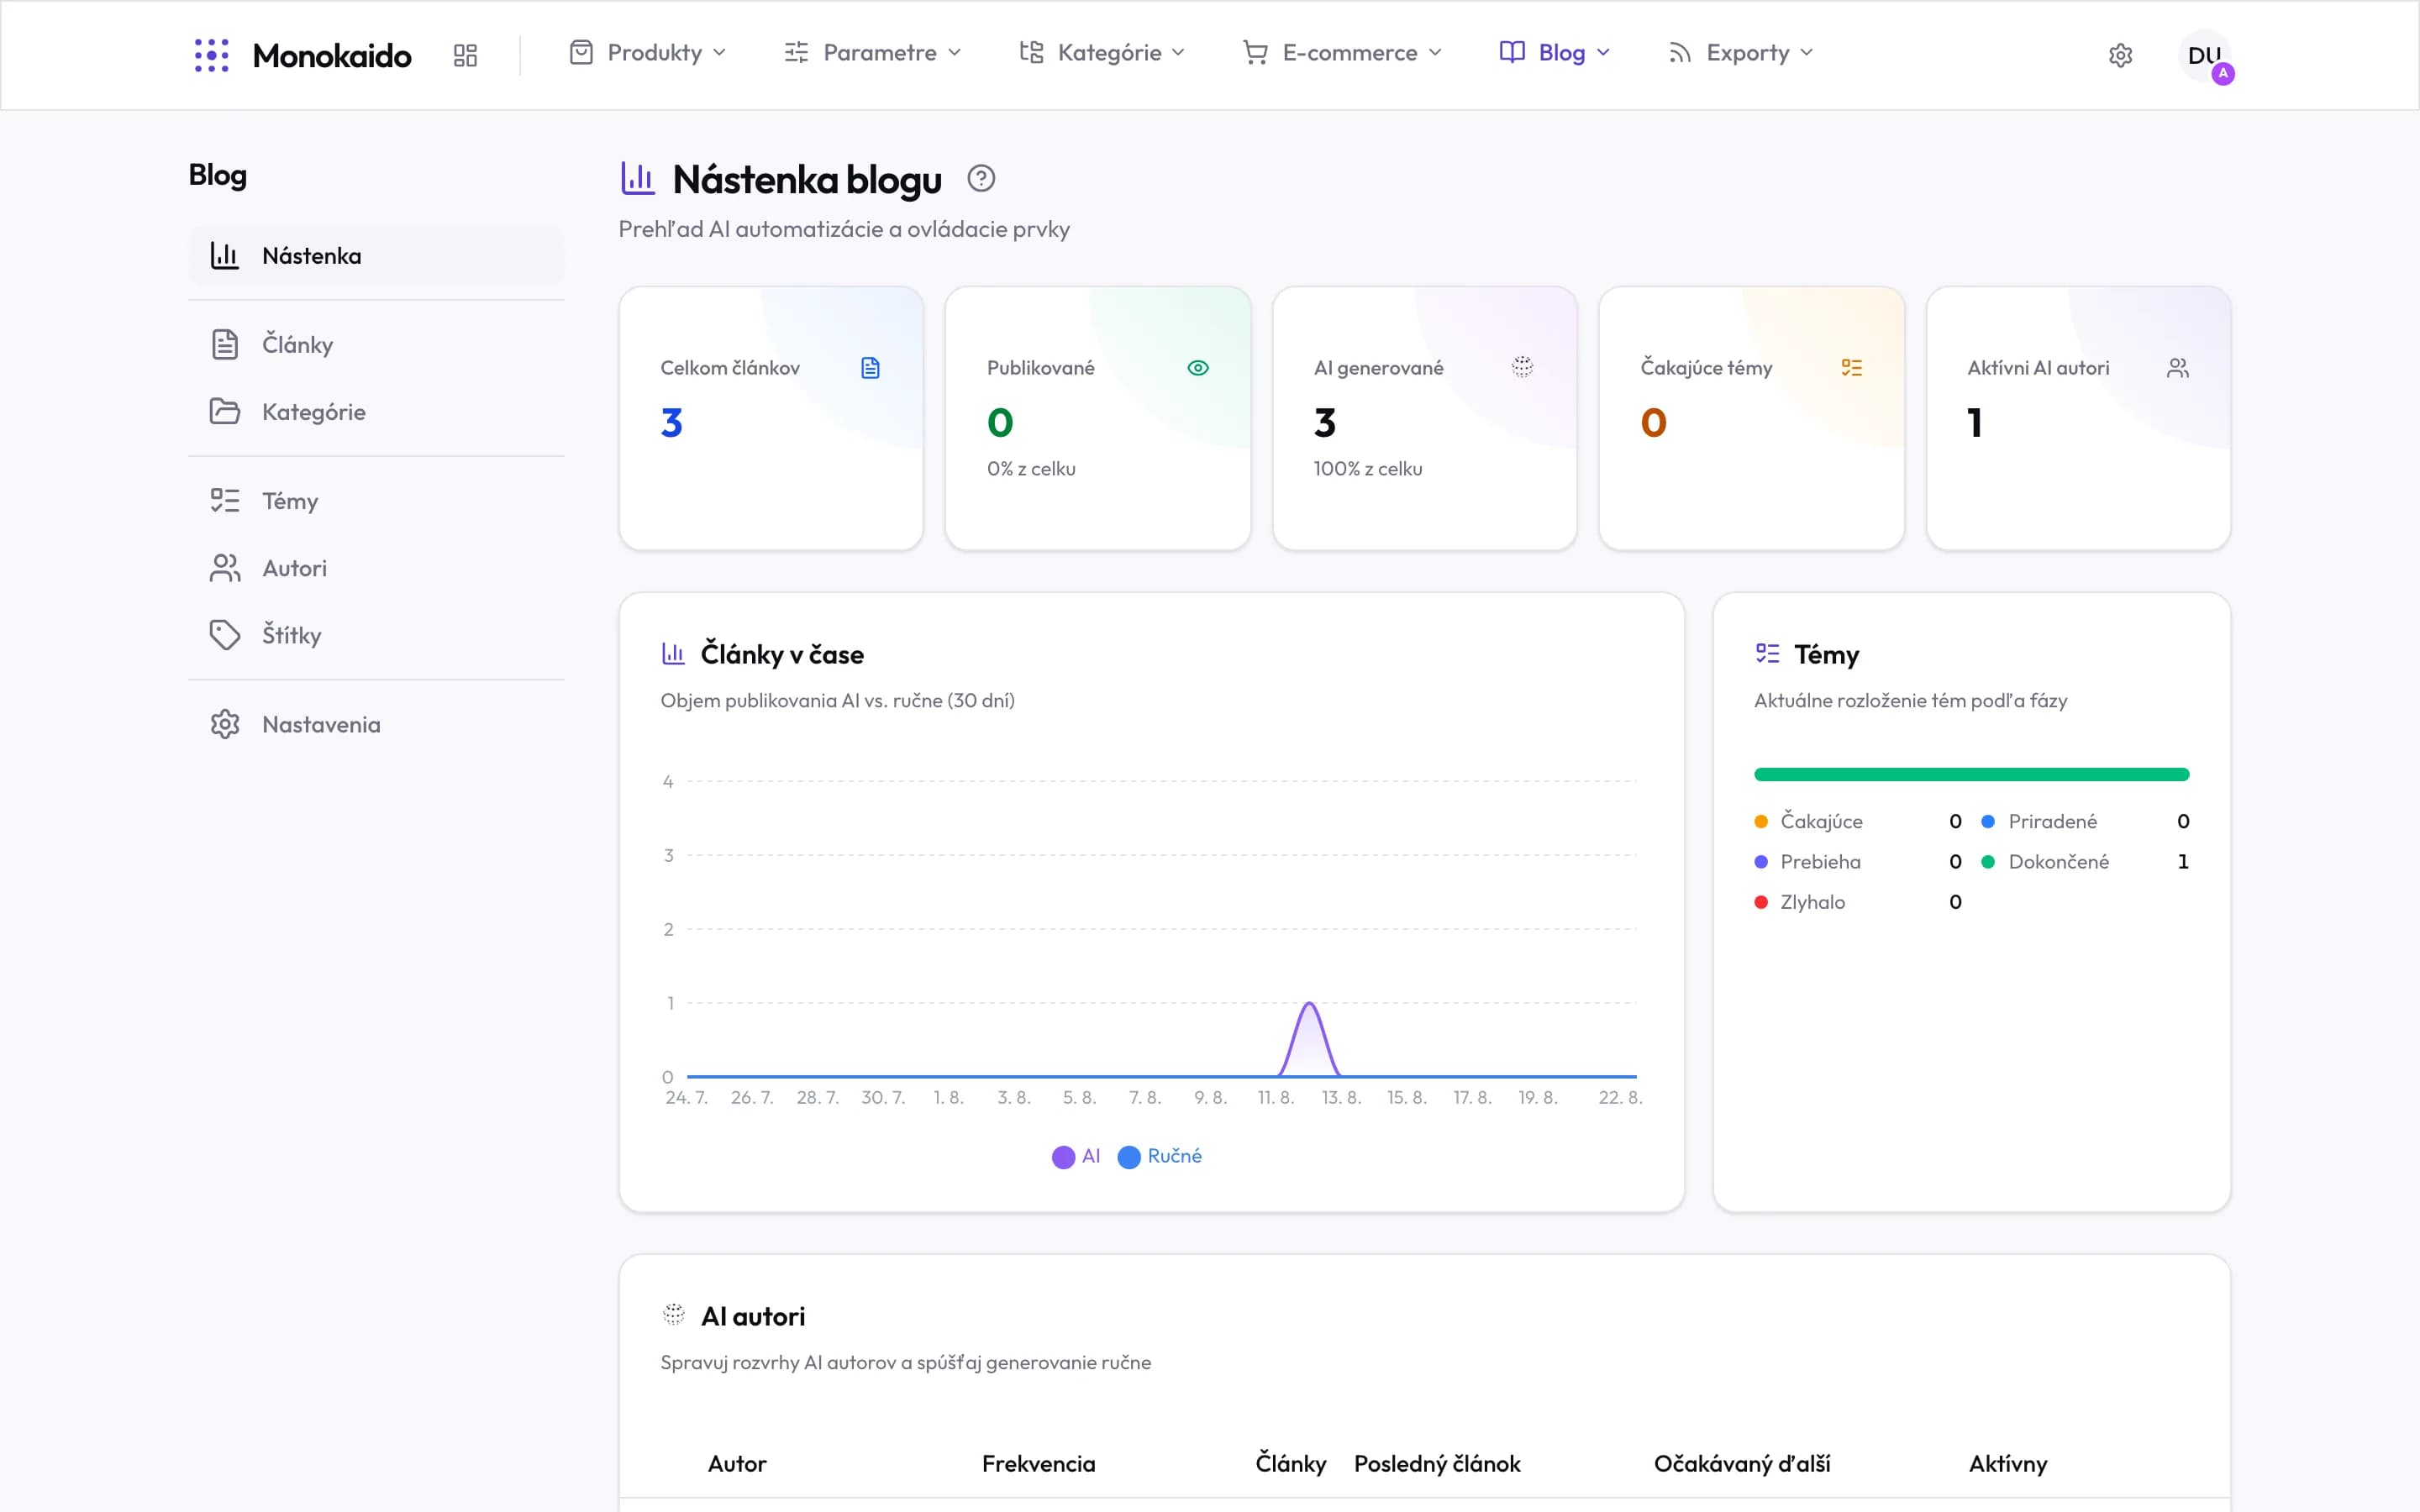
Controls on this screen
- Total articles — Every article, drafts included.
- Published — How many are actually out. The share beneath the number is the point — three articles with none published is a blog nobody reads.
- AI generated — The share written by AI. Neither a target nor a problem — a fact worth knowing.
- Pending topics — The pool of topics that have no article yet.
- Active AI authors — How many authors have a schedule and are actually writing.
- Articles over time — AI versus manual publishing over 30 days. A flat line at zero means the schedule is not running.
- Topic distribution — Where topics stand: pending, assigned, in progress, done, failed. Failed is the only colour that asks for action.
- AI authors — Author schedules and manual generation. This is where the blog gets going when you would rather not wait for the plan.
What you find here
| Figure | What it means | When it wants attention |
|---|---|---|
| Awaiting approval | Generated articles nobody has checked. | When the number climbs — generation is outpacing review. |
| Drafts | Articles in progress. | They block nothing by themselves. |
| Scheduled | Articles with a publish date in the future. | A check that the coming days have something in them. |
| Published | Articles live in the shop. | |
| Topic pool status | How many approved topics are waiting. | Zero means the blog will soon go quiet — see Topic pool. |